2021
Type of resources
Available actions
IADC Research Activities
Topics
Keywords
Contact for the resource
Provided by
Years
Formats
Representation types
Update frequencies
status
Scale
-

Measurements are obtained using a Pyrgeometer Kipp&Zonen, model CGR4, installed at Thule Air Base (220 m a.s.l.) in May 2013. The instrument sensitivity was determined during factory calibration for temperatures down to -40 °C, thus specifically suited for the polar environment. Data are acquired by a datalogger at 30 s time intervals and then transferred to a PC. The CGR4 and its dedicated PC are maintained by Daniela Meloni at ENEA.
-
Snow sampling every year at the Kongsvegen glacier, in Svalbard
-
Mixing state and organic volume fractions of sub micron aerosol particles collected at the Zeppelin observatory
-
Arctic Present Climate Change and Past Extreme Events (ARCA) Analysis of RES datasets available. Production of thematic maps of representative ice-calving effect in some Greenland outlet glaciers. Development and upgrade of INGV RES system.
-
Snow sampling every week near Gruvebadet (Svalbard)
-
pH tipping point in Svalbard (pHinS) The project is focused on carbonate chemistry in the fjord and measure how meltwater, icebergs and freshwater runoff affects the acidity of coastal seawater. Acquisition of CTD profiles and seawater samples at discrete depths (surface, bottom and 1-3 intermediate depths) to determine pH, total alkalinity, dissolved inorganic carbon, dissolved oxygen, nutrients, dissolved organic carbon. Collection of samples from icebergs and streams to determine the same set of parameters measured in the seawater. Some of the analysis were performed in the laboratory of the “Dirigibile Italia” Arctic station soon after the collection; others will be performed on preserved samples in ISMAR’s laboratories. 62 water column profiles of pressure, Temperature, salinity, dissolved oxygen, turbidity instrument: SBE19plus
-

Atmospheric Gondola for Aerosol Profiles (AGAP) The scientific goals of AGAP are to develop novel aerosol payloads and evaluate the vertical distribution of aerosol properties in the Arctic Boundary Layer. Dataset consists in Aerosol vertical profiles gridded at a 50 m spatial resolution: R, T, P, RH, Aerosol size distribution, BC concentration, O3. Maximum altitudes 1500 m.
-
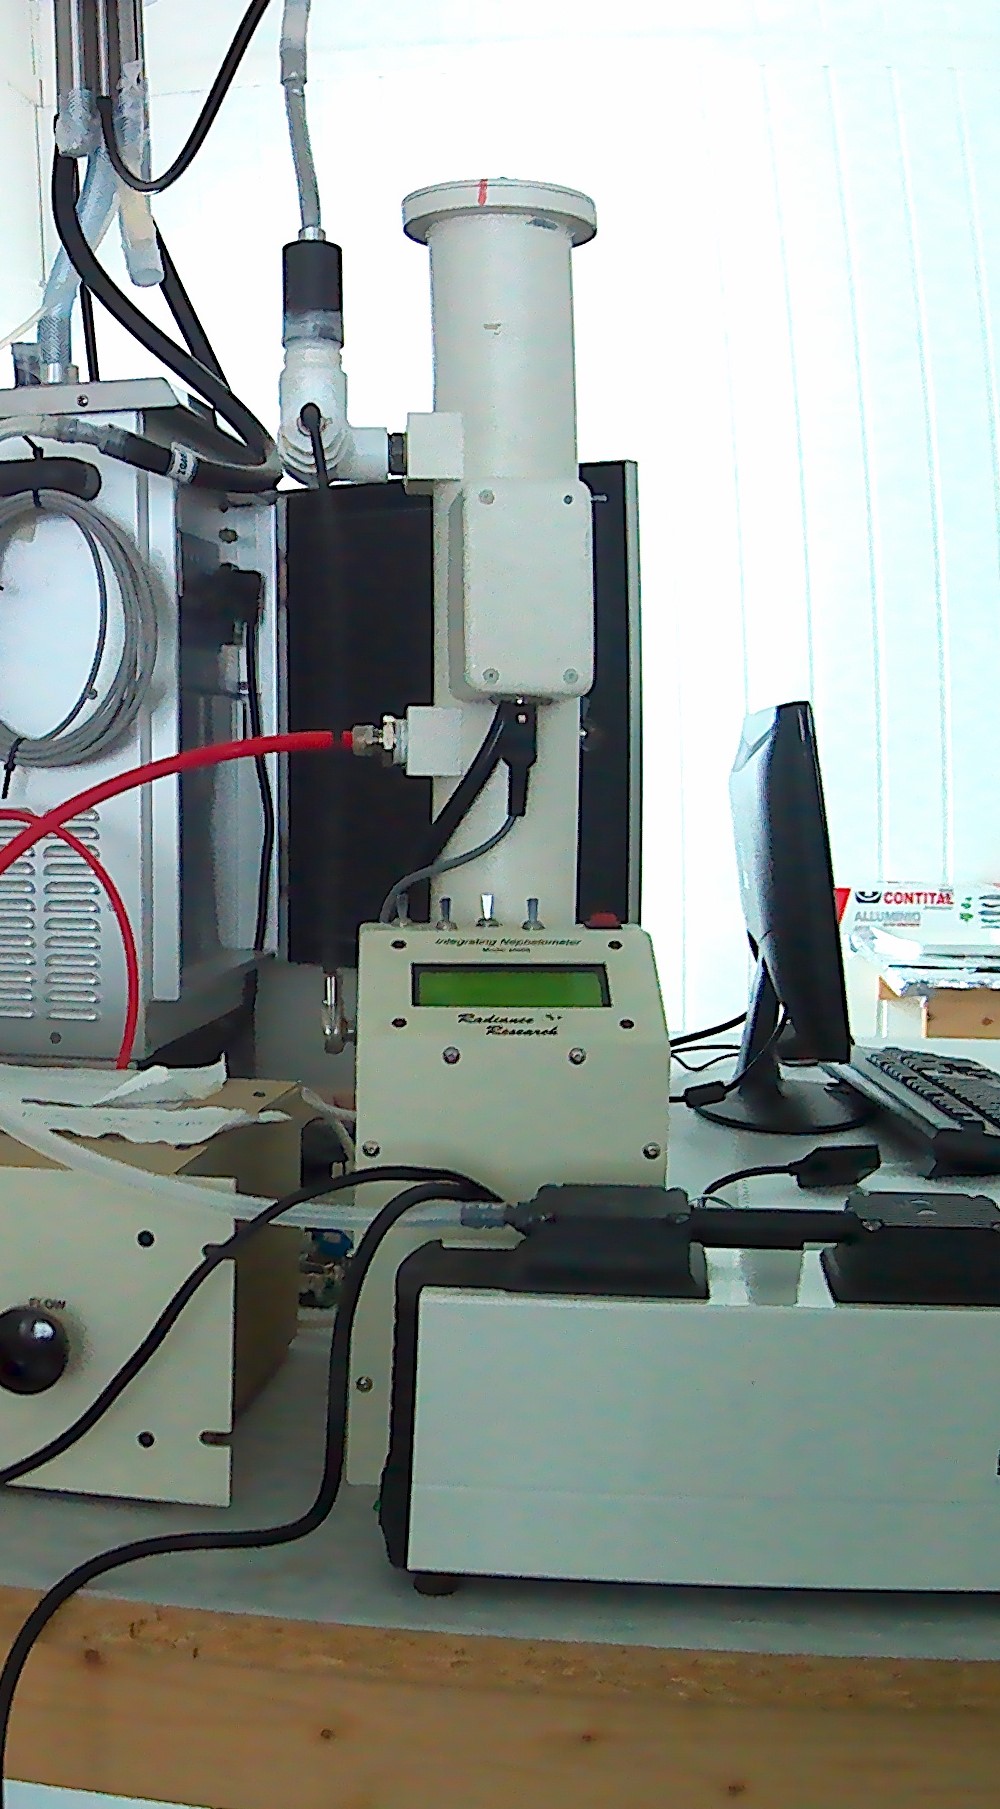
Aerosol scattering at 1 wavelength (530 nm) measured using a nephelometer M903, manufactured by Radiance Research.
-
Brief narrative summary of the content of the resource(s)
-
Characterisation of water dynamics to overcome the information gaps on hydrologic processes in glaciated and unglaciated catchments in southern Spitsbergen. Physical-chemical and isotopic monitoring of streams, piezometers and springs located in Hornsund. The data were generated with support from the following funding sources: INTERACT (2024) and UNDER (2025).