CSV
Type of resources
Available actions
IADC Research Activities
Topics
Keywords
Contact for the resource
Provided by
Years
Formats
Representation types
Update frequencies
status
Scale
-

Cyclone Sample collection Teams collect two weekly 24-hour samples Teams create metadata by scanning QR codes on cyclone sampler and sample vial with Lifeplan app Teams store samples until shipment in a freezer - Sample shipping to Sweden - Sample cleaning by Lifeplan - Sample shipping to Guelph - Sample sequencing - Transfer of sequencing data to Lifeplan - Bioinformatics - Species lists Through LIFEPLAN, we aim to establish the current state of biodiversity across the globe, and to use our insights for generating accurate predictions of its future state under future scenarios. In LIFEPLAN, we thus characterize biological diversity through a worldwide sampling program, and develop the bioinformatic and statistical approaches needed to make the most out of these data.
-
Data collected by the WINTER-CZ Monitoring Station. The CO2 and the temperature is sampled is measured inside the soil, the snowpack (when the station is covered by the snow) and the atmosphere. Other variables are collected as well: the humidity and the oxygen content of the soil, the snowpack height, the humidity and the temperature of the air, the wind speed and direction.
-
Snow sampling every week near Gruvebadet (Svalbard)
-
pH tipping point in Svalbard (pHinS) The project is focused on carbonate chemistry in the fjord and measure how meltwater, icebergs and freshwater runoff affects the acidity of coastal seawater. Acquisition of CTD profiles and seawater samples at discrete depths (surface, bottom and 1-3 intermediate depths) to determine pH, total alkalinity, dissolved inorganic carbon, dissolved oxygen, nutrients, dissolved organic carbon. Collection of samples from icebergs and streams to determine the same set of parameters measured in the seawater. Some of the analysis were performed in the laboratory of the “Dirigibile Italia” Arctic station soon after the collection; others will be performed on preserved samples in ISMAR’s laboratories. 62 water column profiles of pressure, Temperature, salinity, dissolved oxygen, turbidity instrument: SBE19plus
-
Snow sampling every year at the Kongsvegen glacier, in Svalbard
-

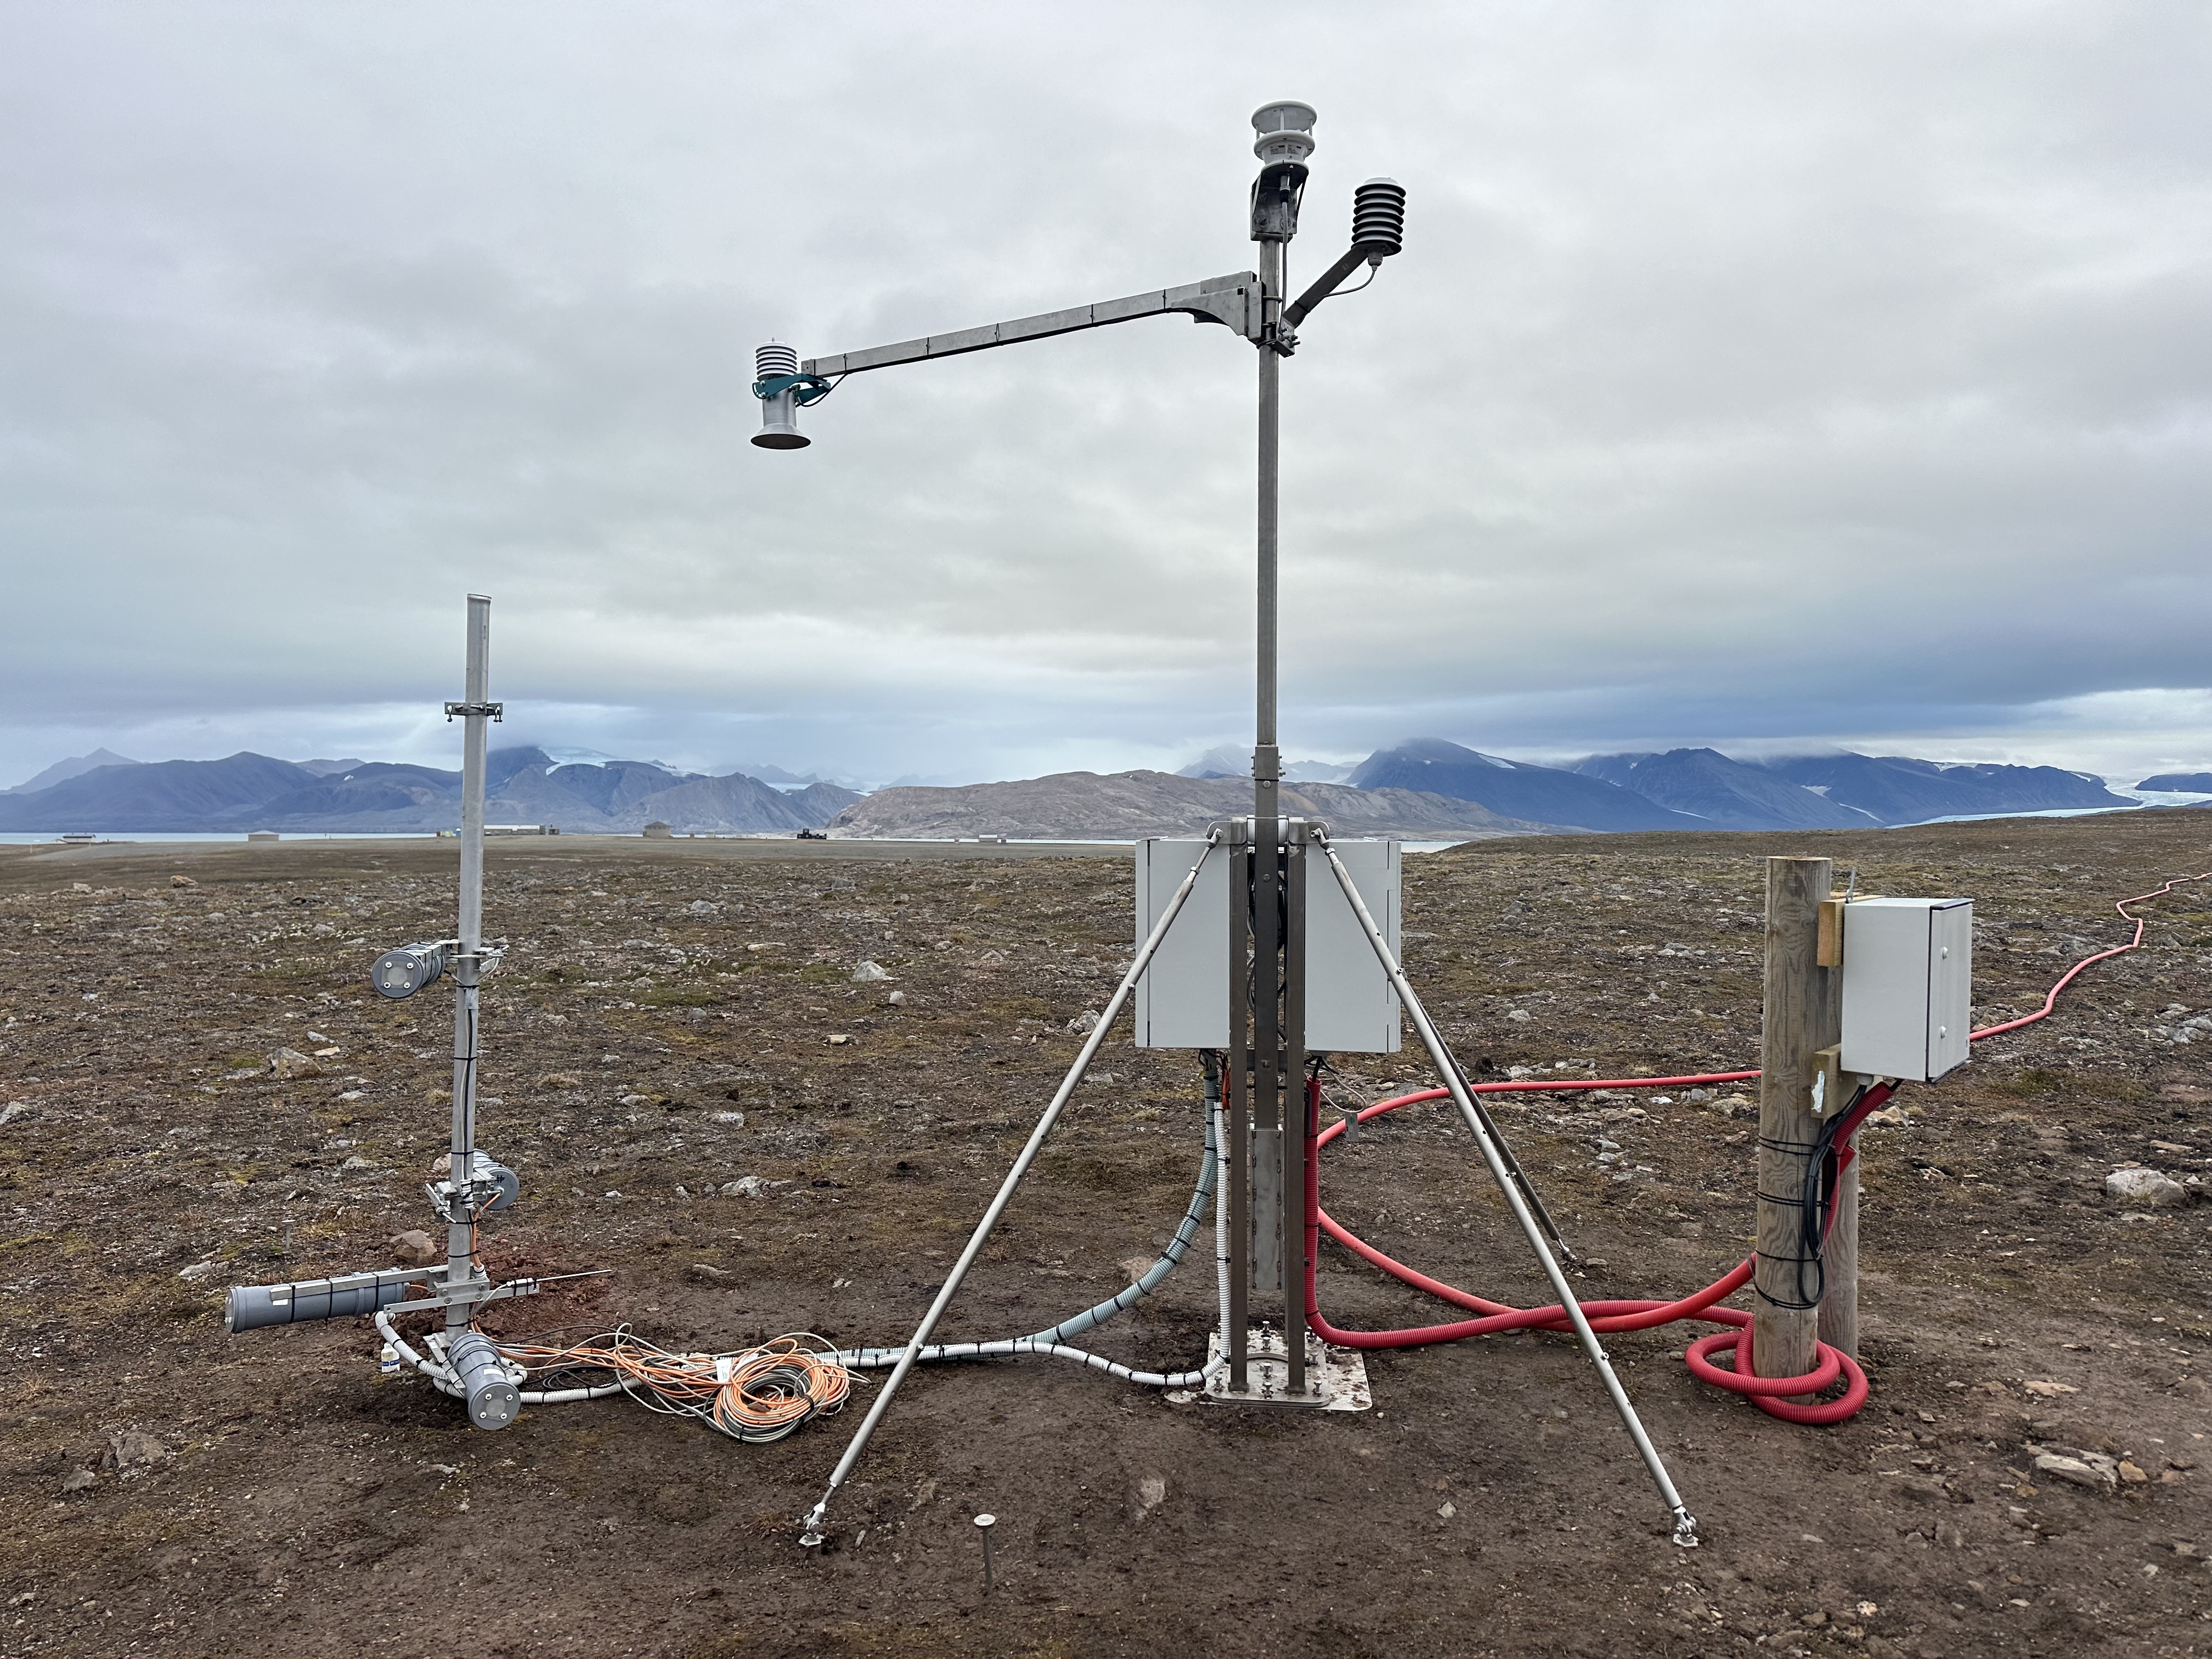
Data refers to the CNR-IGG eddy covariance (EC) facility at the Arctic CZO (Critical Zone Observatory, hereafter CZO@Bayelva in Ny Ålesund). Data have been collected since 2019, all year long, with some interruptions due to ordinary or factory maintenance. The EC tower was installed to study CO2, H20, latent and sensible heat exchanges between soil, vegetation, and atmosphere. Carbon dioxide fluxes and environmental variables are recorded to estimate changes in carbon storage and explore CO2 fluxes drivers in the Arctic tundra. Measured parameters: Net vertical turbulent CO2 flux (umol+1s-1m-2); air temperature (deg_C), air relative humidity (%), wind speed (m+1s-1), max wind speed (m+1s-1), wind direction (deg_from_north). Method: The EC station respects both sensors and data processing standards defined by the ICOS community even if it is not an ICOS-associated station. Flux processing software: EddyPro set to default processing settings. The output variables have a 30-minutes resolution. The parameters available here are obtained by aggregating over a 3-hours time span. The associated measurement time (column B in the uploaded file) indicates the beginning of the 3-hour averaging period (es. Time T= [Time T; Time T+2h30 min]). Instrumentation: 3-Dimensional Sonic Anemometer (Manufacturer: Gill HS-50, s.n.: H183304, Firmware: 3.01, Instrument height: (info in the yearly metadata), North alignment: SPAR, North offset: (info in the yearly metadata), Wind data format: u, v, w); Enclosed path CO2/H2O Gas Analyzer (Licor Li7200RS, s.n.: 72H-0888, Firmware: (info in the yearly metadata), Tube length: 105.8 cm, Tube diameter: 5.33 mm, Northward separation: (info in the yearly metadata), Eastward separation: (info in the yearly metadata), Vertical separation: (info in the yearly metadata)). Quality assurance: Mauder and Foken (2004) flagging policy (0-1-2 system). Here, only high-quality data are reported (qc=0). The CNR-IGG Researchers took the photo of the eddy covariance during the field campaign.
-
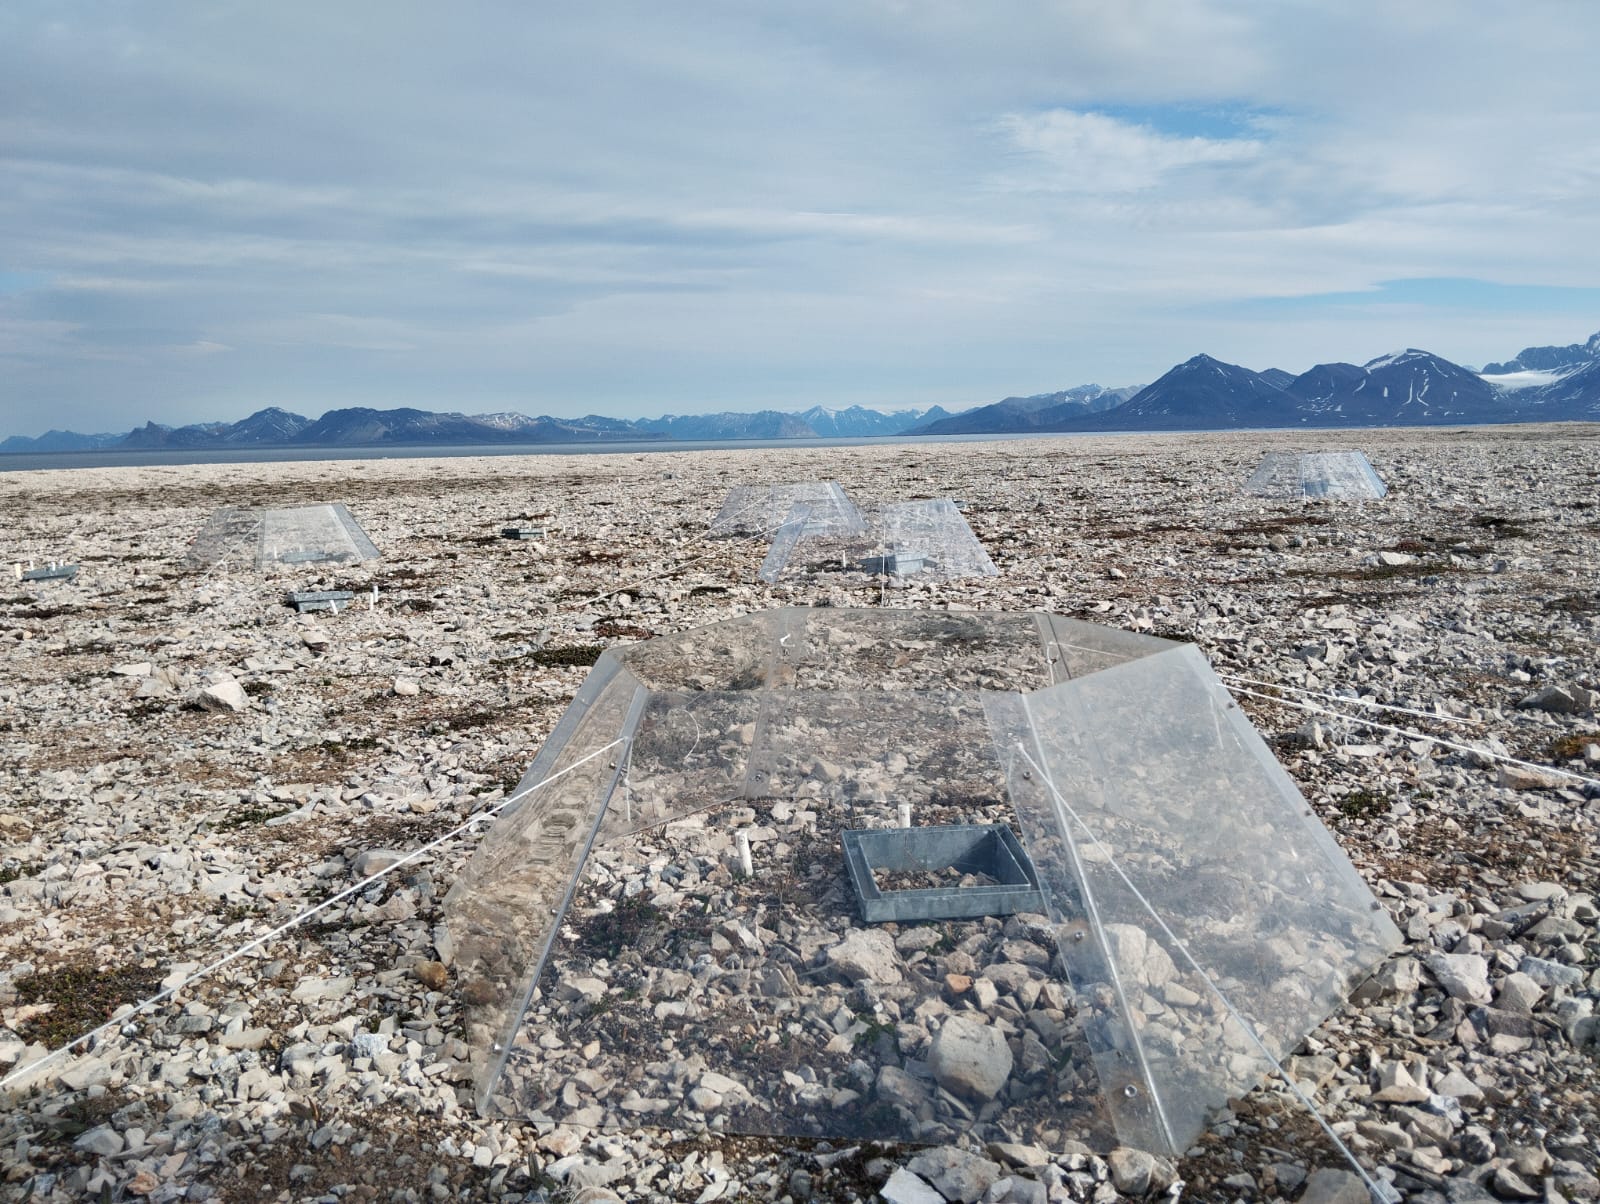
A long-term climate manipulation experiment has been ongoing since 2014 at the REMUS site (Responses of Microbes in Upper Soil Horizons to Environmental Manipulations). Twenty-four open-top chambers (OTCs) were installed to simulate warmer ground temperatures and increased precipitation. To mimic enhanced rainfall, irrigation is applied twice a year, at the end of June and August. The transparent OTCs create an average ground temperature increase of approximately 1°C in the treated plots. The site is located about 11 Km from Ny-Ålesund at Kongsfjordneset (78.96661°N 11.47576°E) on the Brøgger Peninsula. In total, 48 plots with different plant species have been selected for the study. Of these, 24 are equipped with OTCs, while the remaining 24 are irrigated, with half of the irrigated plots also containing OTCs (12 with OTCs, 12 without). The REMUS site is registered on the Research in Svalbard Portal under ID 6921. This site is part of the International Tundra Experiment (ITEX), a global research initiative aimed at understanding the responses of tundra plant species through simple manipulation and transplant experiments conducted across multiple Arctic and alpine sites.
-

Observing Earth critical zone processes in the Bayelva basin (CZO@Bayelva). Data represents the average values and the corresponding standard deviation of Net Ecosystem Exchange (NEE), Ecosystem Respiration (ER) and Gross Primary Productivity (GPP) obtained from two different sites in the tundra of the Bayelva river basin: One site (named CZ) is located in the vicinity of the Climate Change Tower. The other one (named "Airport") is in the vicinity of the Ny Alesund Airport. Each average value is obtained as a mean over a set of around 20 point measures for each plot and each sampling date. Flux data are complemented by measurements of soil temperature, soil volumetric water content, air temperature and relative humidity, and solar irradiance. CO2 fluxes are measured using a flux chamber and a LI-COR IRGA by means of the Dynamic Flux Chamber method.