ISO19139
Type of resources
Available actions
Topics
Keywords
Contact for the resource
Provided by
Years
Formats
Representation types
Update frequencies
status
Scale
-
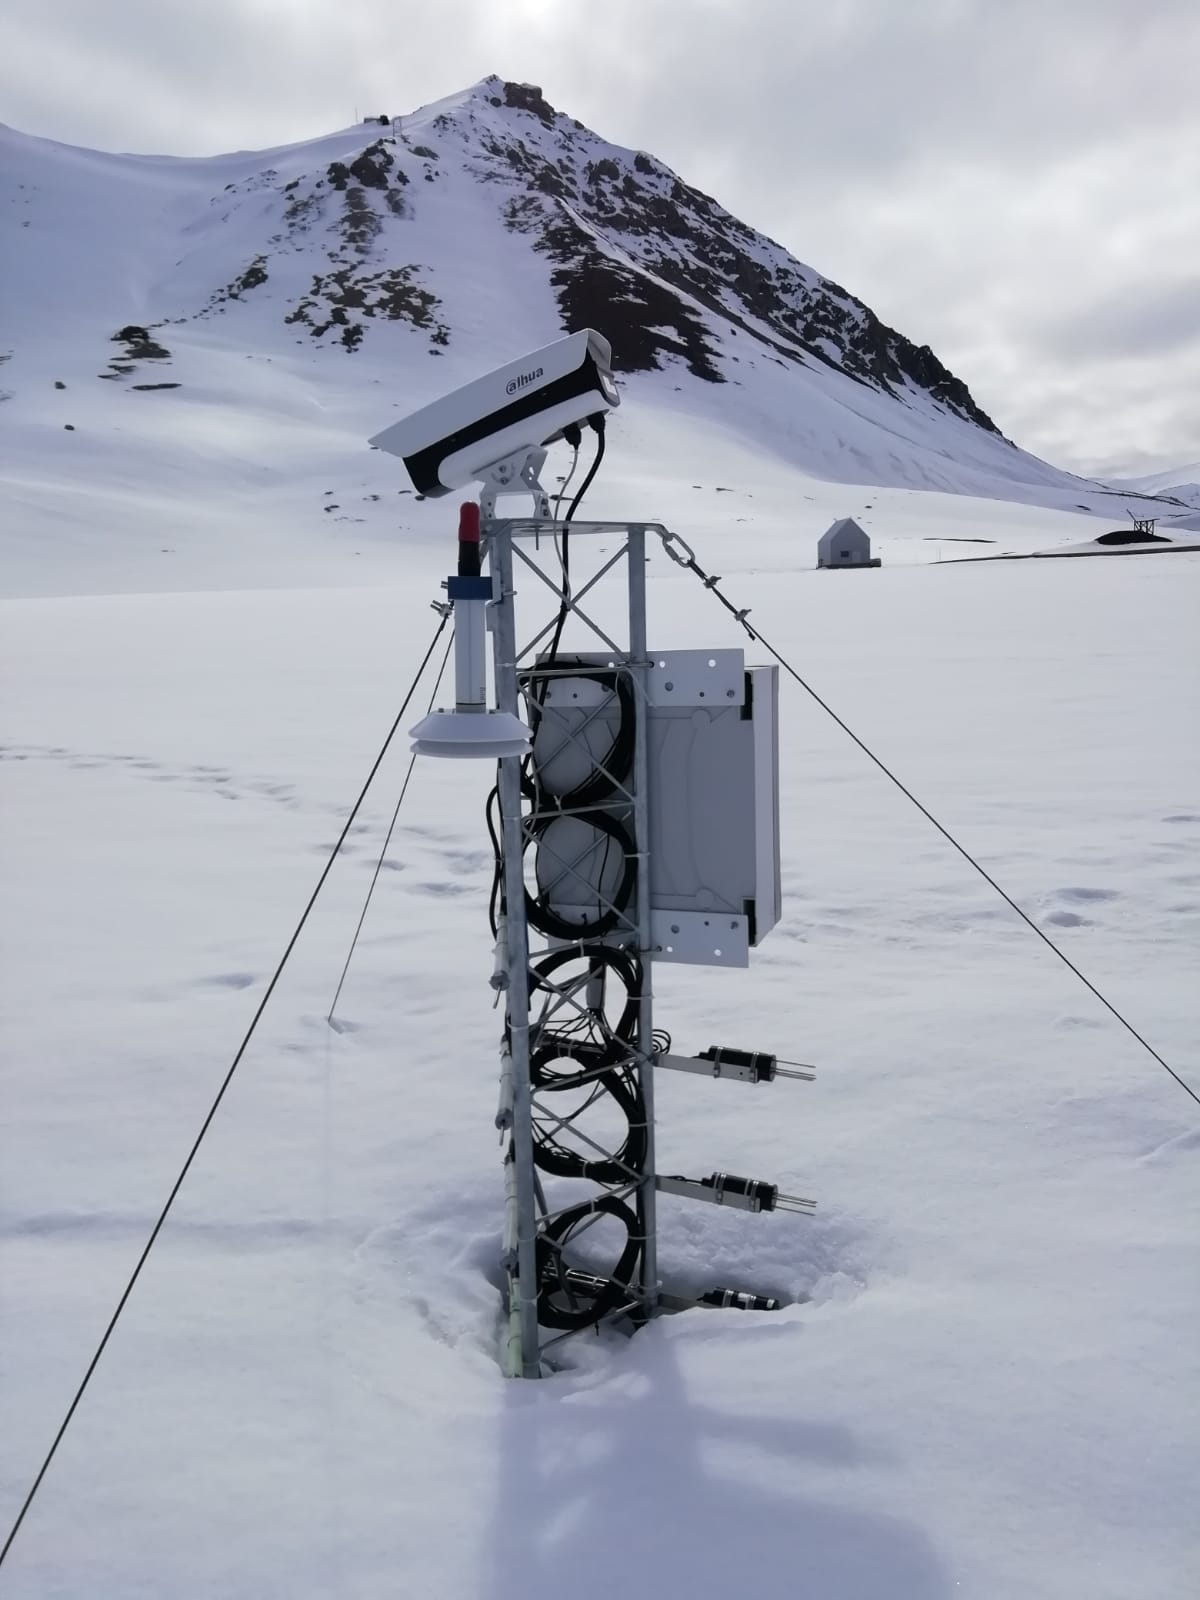
The automated nivological station was installed in November 2020 in a flat area over the tundra about 80 meters far from the Gruvebadet Atmospheric Laboratory and nearby a snow sampling site from where weekly snow samples are collected for chemical analysis. Sensors have been calibrated by their companies before installation and are connected to a datalogger for continuous acquisition. For all the parameters, data are logged with 10-minute time resolution and then averaged over 1 hour. This activity is carried out by the Aldo Pontremoli Centre part of the Joint Research Agreement ENI-CNR.
-

RIS: 11079 ARctic DISsolved CO2 (AR-DIS-CO2) Project start: 2018-08-16 end: 2023-08-16 The project tackles the dynamics of dissolved gases in the ocean water of the Kongsfjorden (Svalbard islands, W archipelago). The main goals are: the characterization and monitoring of Kongfjorden’s waters in terms of dissolved gases species and ii) the identification and understanding of the relationships between dissolved gases time-variations and glaciers melting dynamics. Focus of the research activities is to monitor and comprehend the processes involving major dissolved gas species, trying to identify and understand how drainage melt glaciers influence the TDIC and gas contents of the fjord. The project is also aimed to develop a portable instrument for on-site measurements of TDIC and dissolved gases (in particular CO2, but also O2, N2, Ar, CH4, H2). Vertical profiles of temperature, pH, salinity along selected site in the Kongsfjorden. The selection of measurement sites was addressed to obtain data at least from one of the most deep vertical profile and also from profiles close to main glaciers drainages (Bayelva basin and Kronebreen-Kongsvegen glaciers). TDIC measurements is performed in water samples. water samples in glass bottles pre-evacuated are collected for gases determination.
-
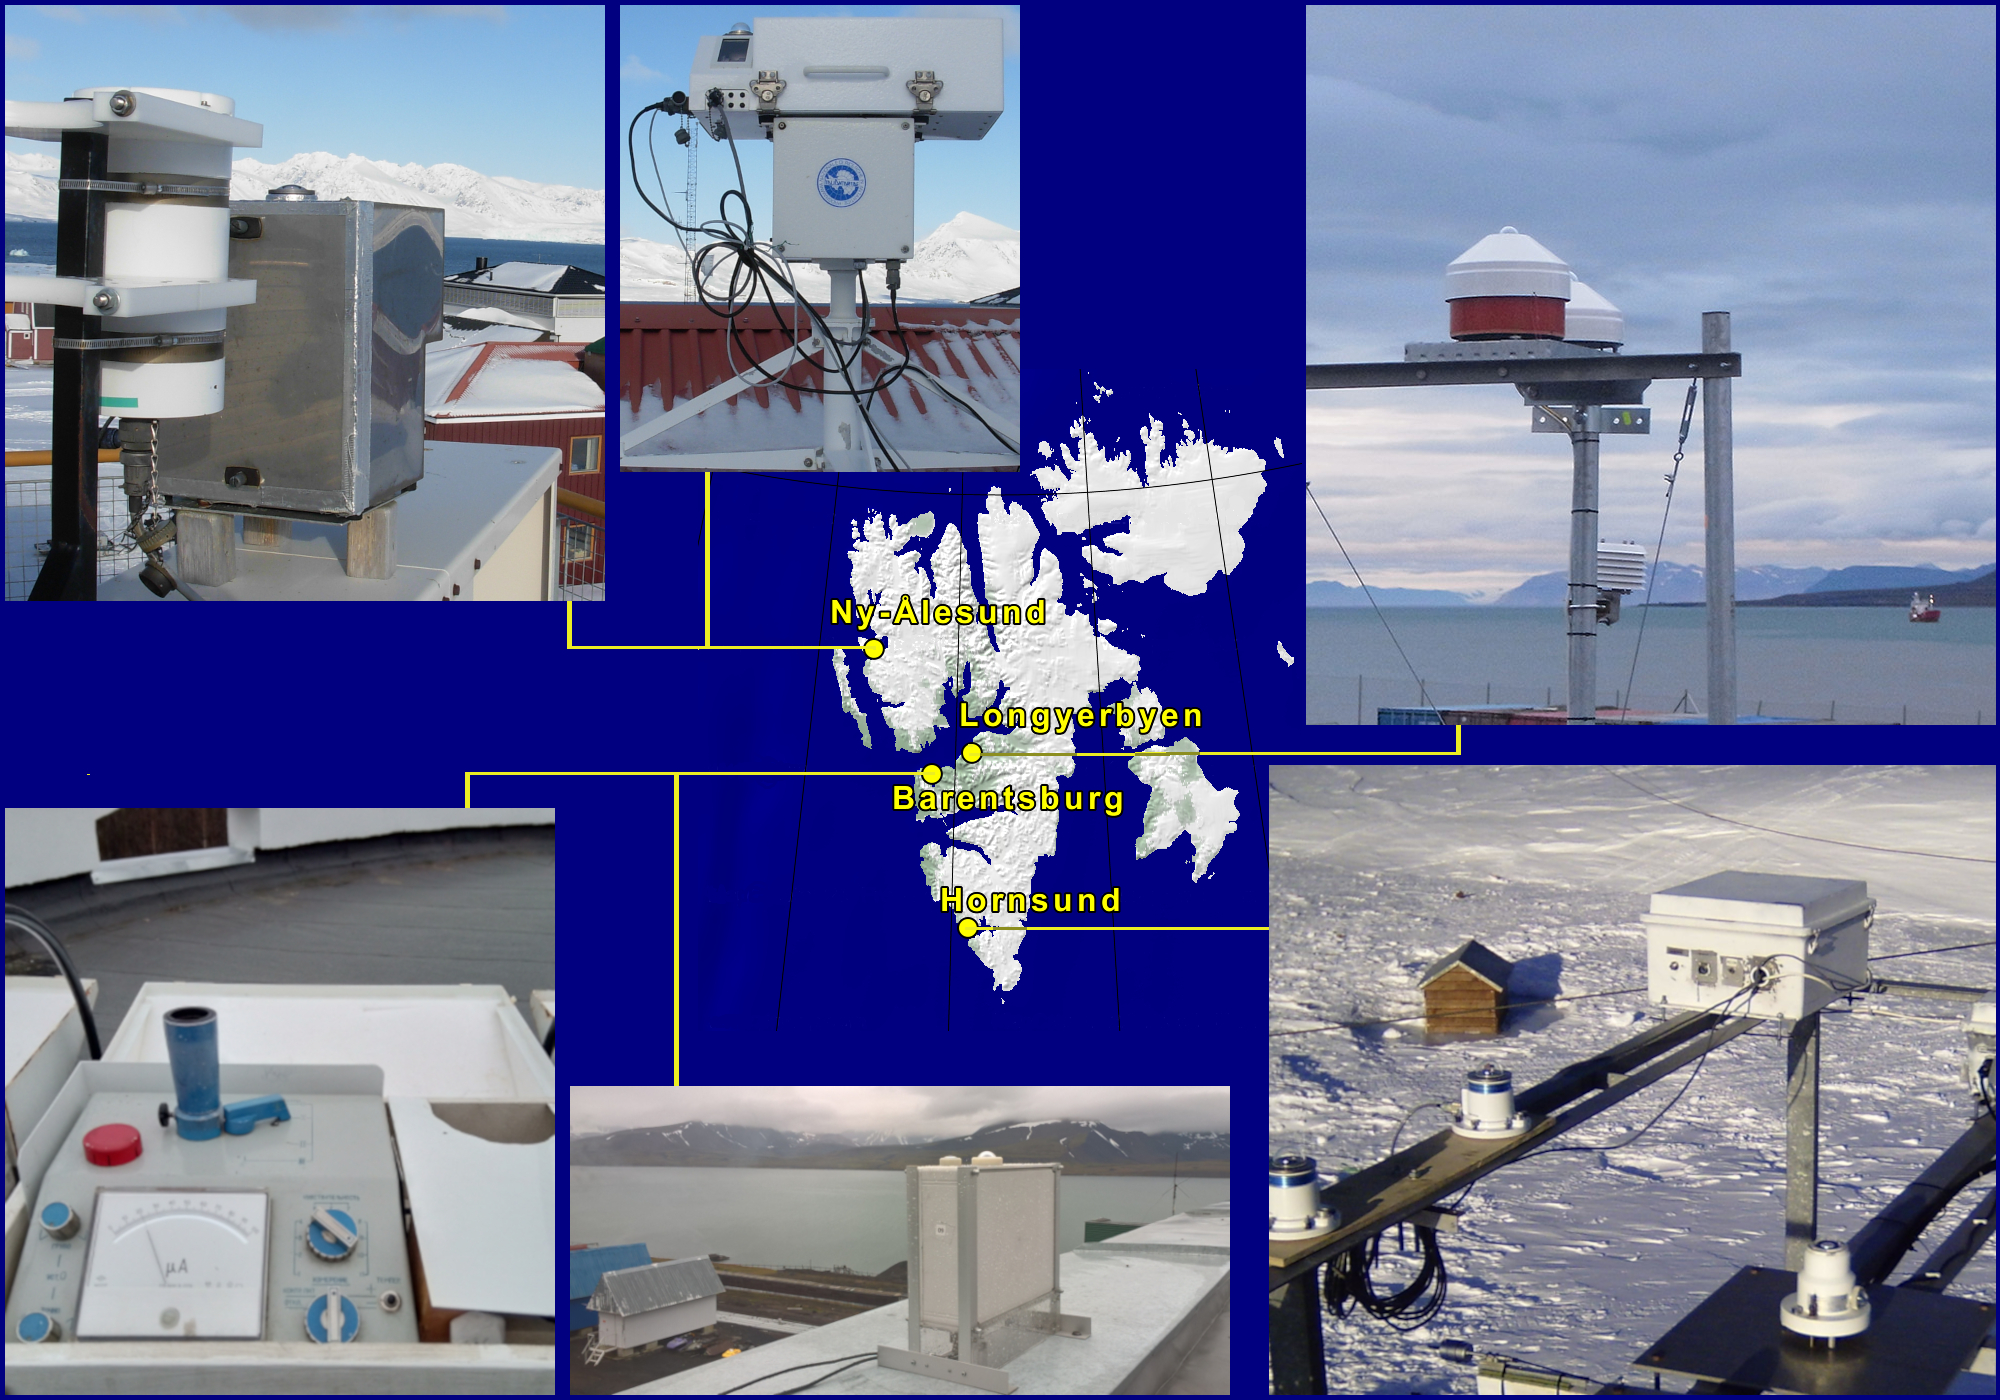
Ultraviolet Irradiance Variability in the Arctic U-VIVA Dataset contains results of the observed at 4 Svalbard stations ozone depletion episode that took place in the spring 2020 and its effect on the ultraviolet solar radiation reaching the ground. The ozone column was registered by Brewer #050 spectroradiometer, GUV and UV-RAD filter radiometers all operating in Ny-Ålesund, and by M-124 ozonometer working in Barentsburg. The solar radiation in UV-B, UV-A and erythemal UVE spectral bands that are impacted by the ozone column was measured by GUV and UV-RAD radiometers at Ny-Ålesund and, by UVS-E-T and UVS-AE-T Kipp & Zonen radiometers operating in Longyearbyen and Hornsund, respectively. An analysis of the data is presented in the 2021 SESS report published by Svalbard Integrated Arctic Earth Observing System (SIOS).
-

Homogenized Tethered Balloon record at station Ny-Ålesund, Spitsbergen in 2018 The scientific goals of BC-3D are to evaluate the distribution of Black Carbon and Mineral Dust in the first layers of atmosphere and surface snow over targeted Svalbard glaciers in order to identify the mechanisms of the air/snow exchanges also assisted by model predictions to provide the full 3D picture. Aerosol vertical profiles by tethered balloon: Aerosol vertical profiles gridded at a 50 m spatial resolution: R, T, P, RH, Aerosol size distribution, BC concentration. Maximum altitudes 1500 m.
-
Ice Nuclei Particle Concentration (INP) Ice nucleating particle (INPs) concentration obtained in spring and summer campaigns in the Arctic Region. Sampling lines allow the aerosol particles collection onto the filters and the sampling line for the continuos measurements of size distribution with the OPC and SMPS. The aim is to improve our understanding of aerosol-cloud-climate interactions and representation of climate models.
-
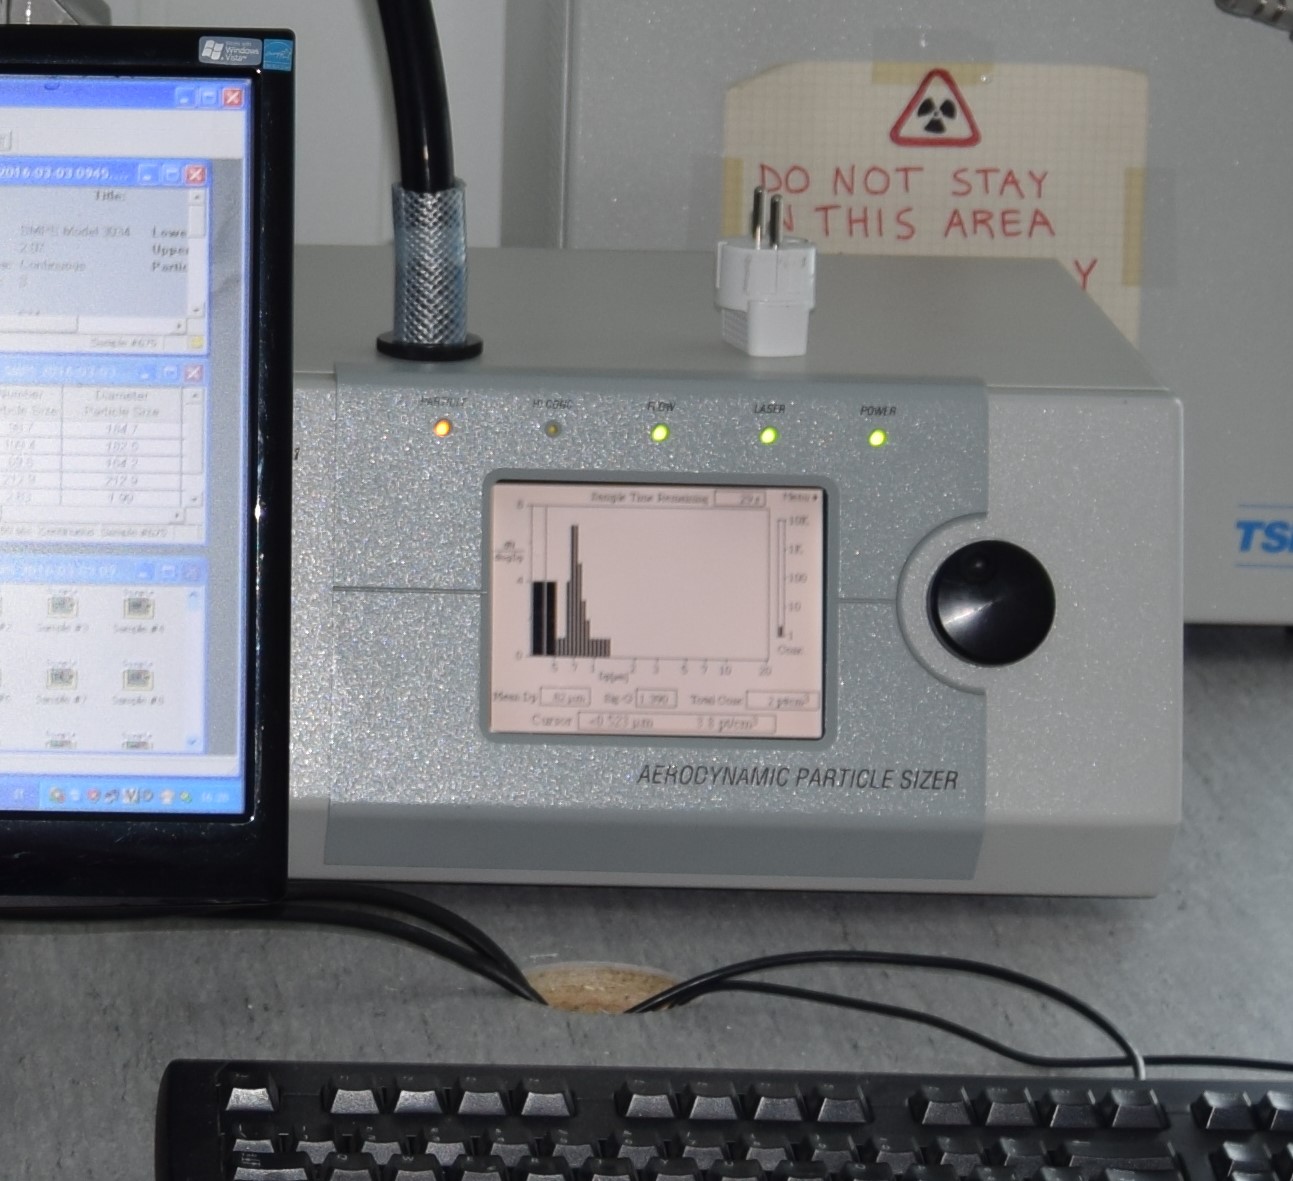
Aerosol size distribution (>500 nm) measured by a SMPS 3321 (TSI).
-

RIS: 3471 ARCA aims to develop a conceptual model on the mechanism(s) behind the release of large volumes of cold and fresh water from melting of ice caps, investigating this complex system from both paleoclimatic and modern air-sea-ice interaction process point of view. ARCA fits well within the Italian Strategy for Arctic. Testing and calibration of sensors measurement of vertical profile of turbulence, meteorological paramaters and characterisitic of the snow surface.
-

The Climate Change Tower Integrated Project (CCT-IP) reflects the priorities of Italian Arctic research and aims to investigate the interactions among all components of the Arctic climate system. The Amundsen-Nobile Climate Change Tower (CCT) serves as the project’s central infrastructure, providing continuous measurements of atmospheric parameters at multiple heights and at the critical interface between the surface and the atmosphere. A SPN1 net radiometer, installed at a height of 33 m in 2023, is used to measure the radiation partition between incoming direct and diffuse irradiance. Previously, in 2009, a combination of sensors—including a CNR1 net radiometer at 33 m and CM11 and CG4 sensors at 25 m—was deployed for the same purpose. Radiation data are processed to provide 30-minute averages (μ) and standard deviations (σ), along with derived products such as total net radiation and an indication of sun presence. These data will be available for download. Additionally, 1-minute resolution data are available for download upon request.
-
Timeseries recorded at the mooring S1, at nominal depth of 1000 m during different deployments. The scope of the measurements is to study the temporal variability of the thermohaline properties of the Norvegian Deep Water, and assosiated deep flow
-
The Climate Change Tower Integrated Project (CCT-IP) represents the guide lines of the italian research in the arctic and aims to study the interaction between all the components of the climate system in the Arctic. The Amundsen-Nobile Climate Change Tower (CCT) is the key infrastructure of the project, and provides continuous acquisition of the atmospheric parameters at different heights as well as at the interface between the surface and the atmosphere. Turbulent parameters are measured at the Amundsen-Nobile Climate Change Tower (CCT) by means of a Gill R3 sonic anemometer installed at 7.5 m from the ground since 2010. It measures the three components of the wind (u, v and w) and the sonic temperature at a rate of 20 Hz. These micro-meteorological measurements are complemented by standard meteorological ones at 4 levels: 2, 5, 10 and 33 m (acquisition time step equal to 1 minute). From these measurements, sensible heat flux, friction velocity and roughness length are calculated. Wind components and sonic temperature measurements were used to estimate friction velocity and kinematic heat flux. Before computing the micrometeorological parameters, a preliminary analysis is applied in order to assess the data quality and to remove low quality records. After the quality analysis application, mean values of the turbulence statistics were computed following two coordinate rotations to ensure the mean lateral and vertical velocities were zero (McMillen, 1988). Half-hour turbulent statistics (heat fluxes and friction velocity) were derived using two time-scales: a standard averaging time of 30 min and a reduced one (2 min) necessary for filtering out submeso motions contributions that can greatly alter the estimation of turbulent fluxes in a strong and long-lived stable BL. The short averaging time scale was evaluated on the basis of spectral analysis of data in order to include all turbulent scales, but excluding submeso motions (larger than turbulence). The turbulent statistics evaluated over the short subsets and then re-averaged over 30 min following Vickers and Mahrt (2006). Turbulent parameter relative to unfavorable wind direction ([150÷270] degrees) for which the tower was upwind of the sonic anemometer were not discarded but are flagged (flagdir=1) in the final dataset. More, the percentage of NaNs relative to each run is indicated. The wind speed vertical profile measured by slow response standard meteorological anemometers at 2, 5, 10 and 33 m was used for estimating the roughness length assuming a typical log wind profile under statically neutral conditions. Mahrt, L., 1998. Flux Sampling Errors for aircraft and towers. J. Atmos. Ocean. Technol. 15, 416-429. Mc Millen, R.T., 1988. An Eddy correlation technique with extended applicability to non-simple terrain. Boundary-Layer Meteorol. 43, 231-245. Vickers D, Mahrt L. 2006. A solution for flux contamination by mesoscale motions with very weak turbulence. Boundary-Layer Meteorol. 118: 431–447. https://doi.org/10.1007/s10546-005-9003-y. Zahn, E., Chor, T.L., Dias, N. L., 2016. A Simple Methodology for Quality Control of Micrometeorological Datasets. American Journal of Environmental Engineering 6(4A): 135-142 DOI: 10.5923/s.ajee.201601.20.