SONIC ANEMOMETER
Type of resources
Available actions
Topics
Keywords
Contact for the resource
Provided by
Years
Formats
Representation types
Update frequencies
status
Scale
-

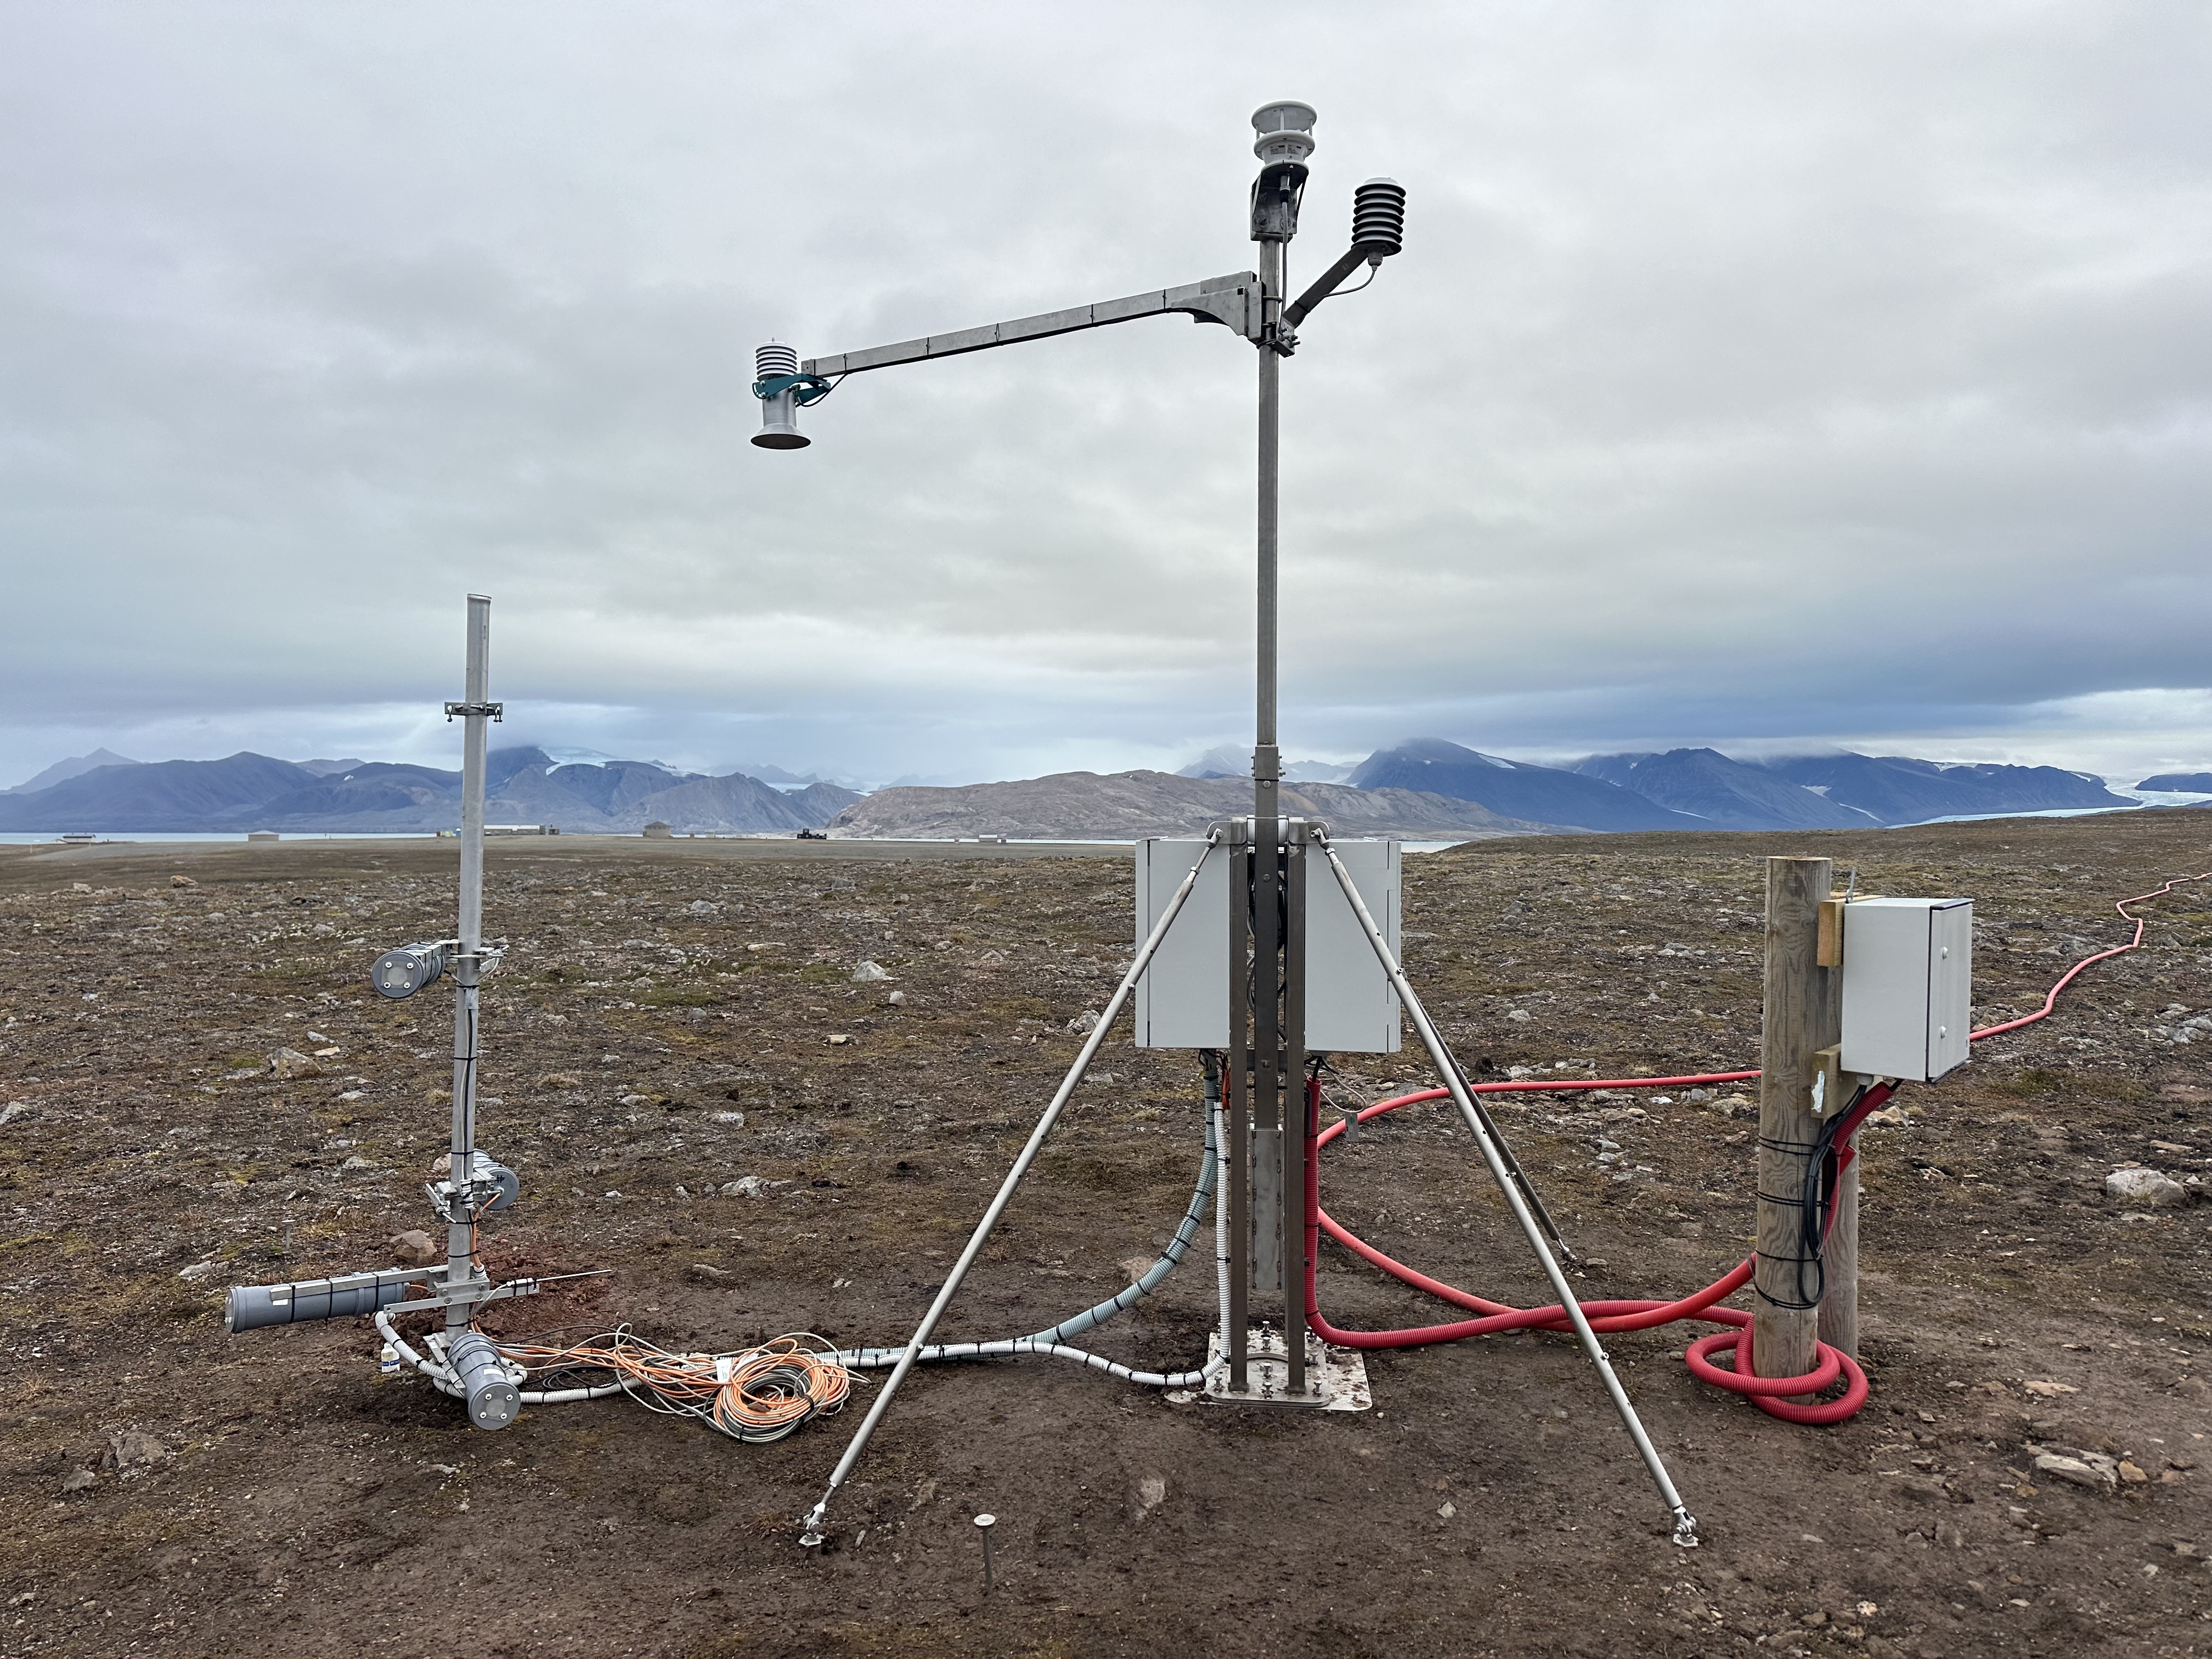
Data refers to the CNR-IGG eddy covariance (EC) facility at the Arctic CZO (Critical Zone Observatory, hereafter CZO@Bayelva in Ny Ålesund). Data have been collected since 2019, all year long, with some interruptions due to ordinary or factory maintenance. The EC tower was installed to study CO2, H20, latent and sensible heat exchanges between soil, vegetation, and atmosphere. Carbon dioxide fluxes and environmental variables are recorded to estimate changes in carbon storage and explore CO2 fluxes drivers in the Arctic tundra. Measured parameters: Net vertical turbulent CO2 flux (umol+1s-1m-2); air temperature (deg_C), air relative humidity (%), wind speed (m+1s-1), max wind speed (m+1s-1), wind direction (deg_from_north). Method: The EC station respects both sensors and data processing standards defined by the ICOS community even if it is not an ICOS-associated station. Flux processing software: EddyPro set to default processing settings. The output variables have a 30-minutes resolution. The parameters available here are obtained by aggregating over a 3-hours time span. The associated measurement time (column B in the uploaded file) indicates the beginning of the 3-hour averaging period (es. Time T= [Time T; Time T+2h30 min]). Instrumentation: 3-Dimensional Sonic Anemometer (Manufacturer: Gill HS-50, s.n.: H183304, Firmware: 3.01, Instrument height: (info in the yearly metadata), North alignment: SPAR, North offset: (info in the yearly metadata), Wind data format: u, v, w); Enclosed path CO2/H2O Gas Analyzer (Licor Li7200RS, s.n.: 72H-0888, Firmware: (info in the yearly metadata), Tube length: 105.8 cm, Tube diameter: 5.33 mm, Northward separation: (info in the yearly metadata), Eastward separation: (info in the yearly metadata), Vertical separation: (info in the yearly metadata)). Quality assurance: Mauder and Foken (2004) flagging policy (0-1-2 system). Here, only high-quality data are reported (qc=0). The CNR-IGG Researchers took the photo of the eddy covariance during the field campaign.
-
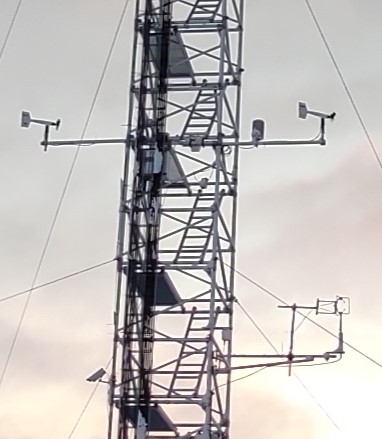
The Climate Change Tower Integrated Project (CCT-IP) represents the guide lines of the italian research in the arctic and aims to study the interaction between all the components of the climate system in the Arctic. The Amundsen-Nobile Climate Change Tower (CCT) is the key infrastructure of the project, and provides continuous acquisition of the atmospheric parameters at different heights as well as at the interface between the surface and the atmosphere. Turbulent parameters are measured at the Amundsen-Nobile Climate Change Tower (CCT) by means of a Gill R3 sonic anemometer installed at 7.5 m from the ground since 2010. It measures the three components of the wind (u, v and w) and the sonic temperature at a rate of 20 Hz. These micro-meteorological measurements are complemented by standard meteorological ones at 4 levels: 2, 5, 10 and 33 m (acquisition time step equal to 1 minute). From these measurements, sensible heat flux, friction velocity and roughness length are calculated. Wind components and sonic temperature measurements were used to estimate friction velocity and kinematic heat flux. Before computing the micrometeorological parameters, a preliminary analysis is applied in order to assess the data quality and to remove low quality records. After the quality analysis application, mean values of the turbulence statistics were computed following two coordinate rotations to ensure the mean lateral and vertical velocities were zero (McMillen, 1988). Half-hour turbulent statistics (heat fluxes and friction velocity) were derived using two time-scales: a standard averaging time of 30 min and a reduced one (2 min) necessary for filtering out submeso motions contributions that can greatly alter the estimation of turbulent fluxes in a strong and long-lived stable BL. The short averaging time scale was evaluated on the basis of spectral analysis of data in order to include all turbulent scales, but excluding submeso motions (larger than turbulence). The turbulent statistics evaluated over the short subsets and then re-averaged over 30 min following Vickers and Mahrt (2006). Turbulent parameter relative to unfavorable wind direction ([150÷270] degrees) for which the tower was upwind of the sonic anemometer were not discarded but are flagged (flagdir=1) in the final dataset. More, the percentage of NaNs relative to each run is indicated. The wind speed vertical profile measured by slow response standard meteorological anemometers at 2, 5, 10 and 33 m was used for estimating the roughness length assuming a typical log wind profile under statically neutral conditions. Mahrt, L., 1998. Flux Sampling Errors for aircraft and towers. J. Atmos. Ocean. Technol. 15, 416-429. Mc Millen, R.T., 1988. An Eddy correlation technique with extended applicability to non-simple terrain. Boundary-Layer Meteorol. 43, 231-245. Vickers D, Mahrt L. 2006. A solution for flux contamination by mesoscale motions with very weak turbulence. Boundary-Layer Meteorol. 118: 431–447. https://doi.org/10.1007/s10546-005-9003-y. Zahn, E., Chor, T.L., Dias, N. L., 2016. A Simple Methodology for Quality Control of Micrometeorological Datasets. American Journal of Environmental Engineering 6(4A): 135-142 DOI: 10.5923/s.ajee.201601.20.
-
Data collected by the WINTER-CZ Monitoring Station. The CO2 and the temperature is sampled is measured inside the soil, the snowpack (when the station is covered by the snow) and the atmosphere. Other variables are collected as well: the humidity and the oxygen content of the soil, the snowpack height, the humidity and the temperature of the air, the wind speed and direction.